Visual Ejercicios de gráficos de barra las
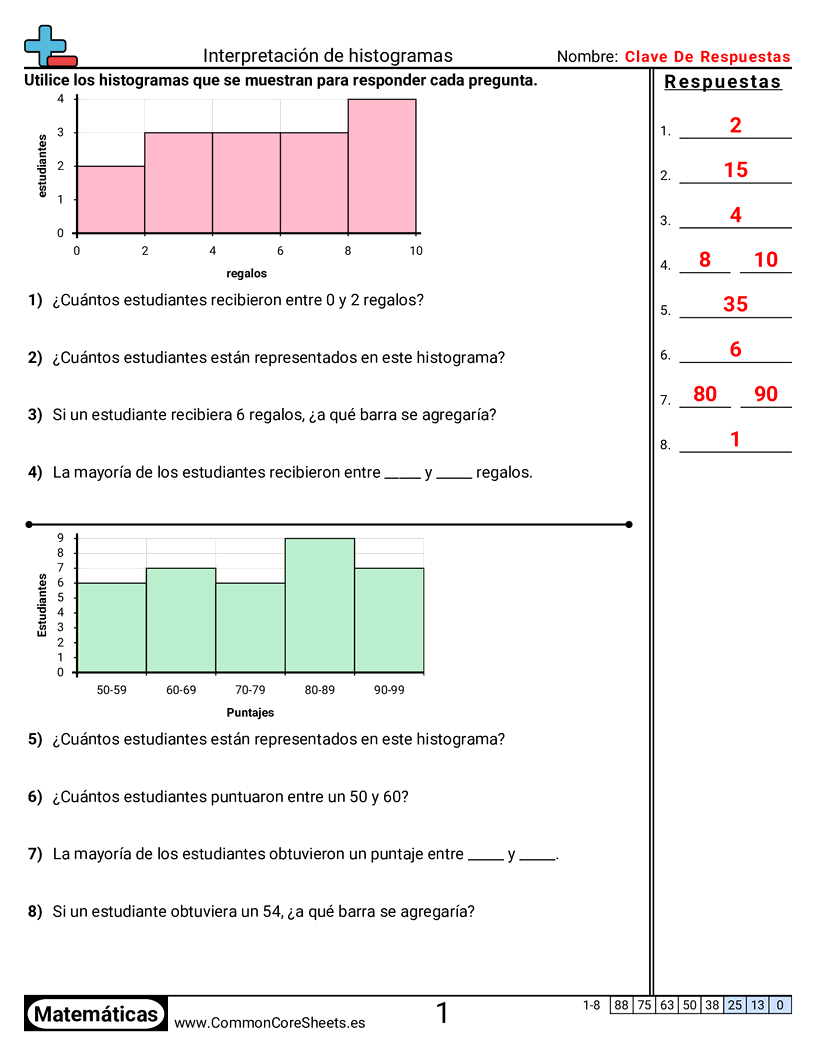
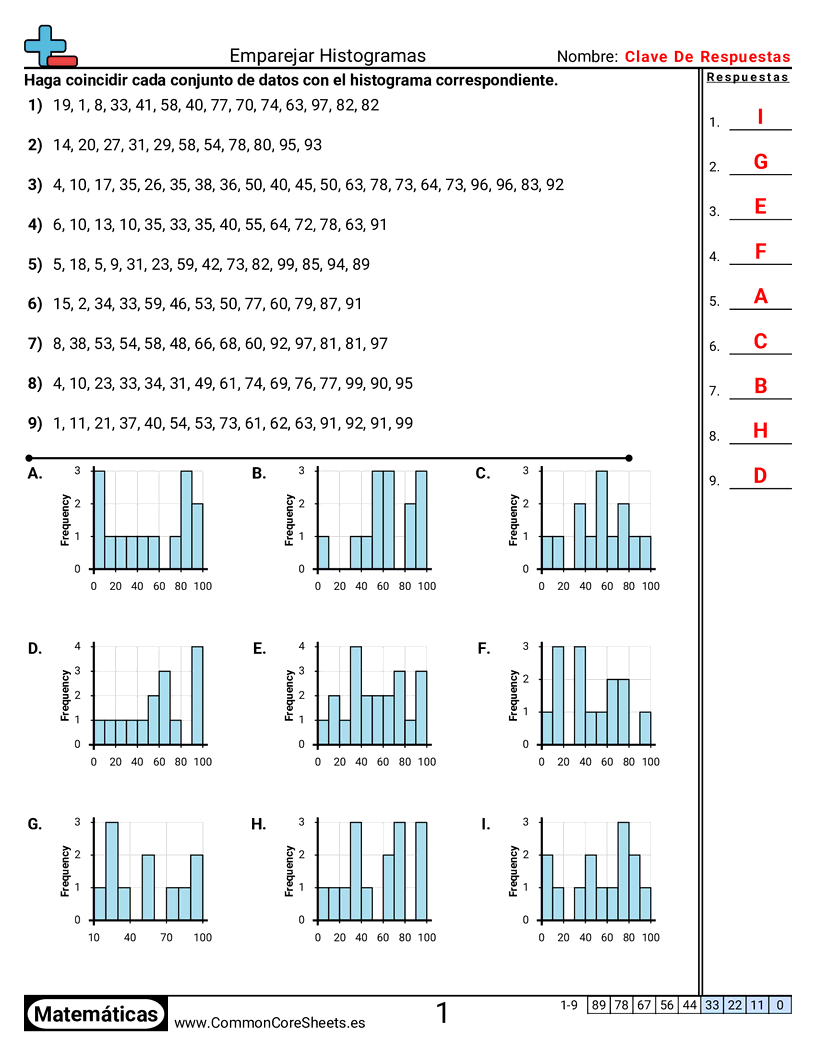
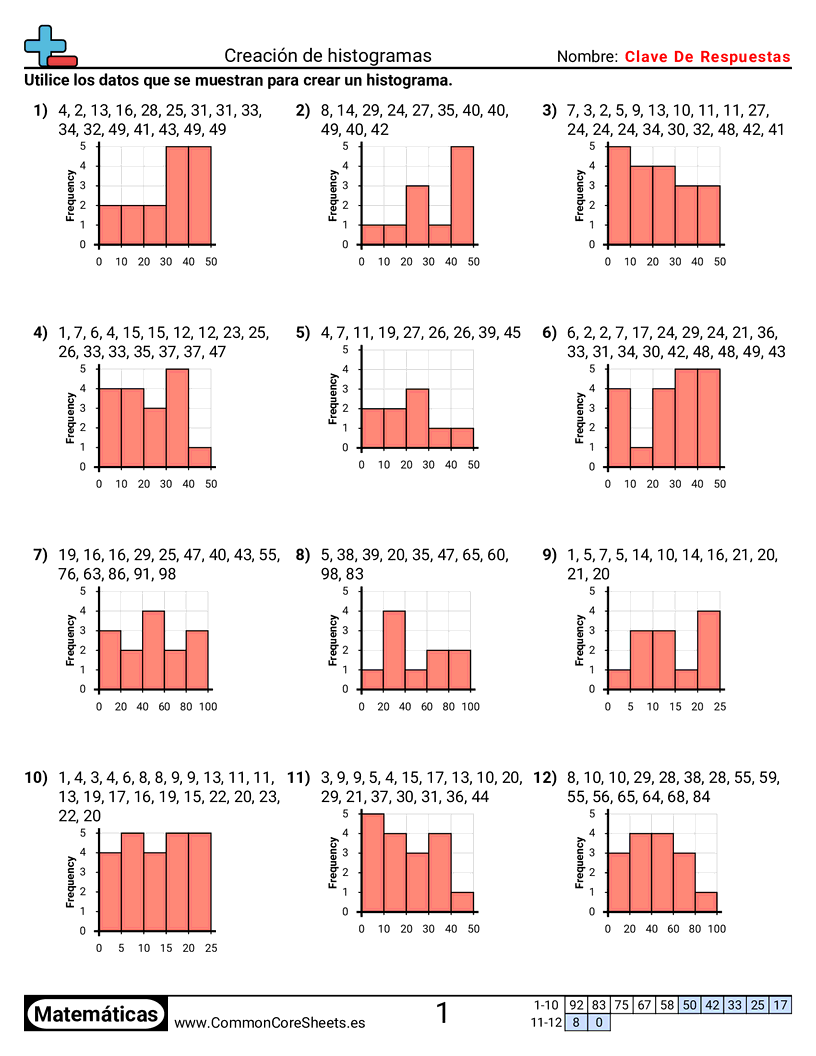
Our Visual Bar Graph Worksheets provide hands-on practice with reading, interpreting, and creating bar graphs through visual problem-solving. These worksheets help students develop critical data analysis skills by working with charts, histograms, and graph matching exercises that make abstract concepts concrete and accessible.
Grade & filters


About these worksheets
Students learn to work with histograms — a key data display for grouped numerical data. Worksheets cover creating histograms from data sets by sorting values into intervals, interpreting existing histograms to answer questions about frequency and distribution, and matching data sets to the correct histogram. These resources help students understand how data can be grouped and visualized.

tarjetas flash

Crear nueva hoja

Seleccionar ejercicios >
versión 1
versión 2
versión 3
versión 4
versión 5
versión 6
versión 7
versión 8
versión 9
versión 10
Usar todas